SettleMath

Live 2 min delayed

Pricing · from $14.99/wk
2 min behind

You're on the free view. Every number on this page is 2 minutes old, and the signals 3 minutes. Pro members are already 2 minutes further into this window, with the bot's buys, the signals, whale orders and indicators live.

New in Pro 1 vetted signal on the leaderboard, ranked by what they did after we found them. See what Pro sees

See it live: Pro from $14.99 a week, cancel anytime →

Work in progress We're bringing the ETH page up to the Bitcoin one. The price is the official index (CF Benchmarks ETH RTI) and the final minute counts its own seconds. Collecting data until about Nov 15: since Nov 8 every second of ETH's indicators, its order book, seven exchanges' order flow and whale orders is being recorded; the indicator panels, signals, the Lab, the leaderboard and the bot for ETH come once there are enough ETH markets to test them on honestly (about Nov 15 for the first, Nov 22 for the bot).Collecting ETH data until about Nov 15; signals, the Lab and the bot come after. The Bitcoin page has all of it now →

Bitcoin up or down

Live market here (opens in a new tab)

--:--leftFree view: 2 min behind

Strike
—
BTC
—
From the strike
—

Yes price

SettleMath model

—

its chance of Up, from 33 live readings

Market

—

mid of bid and ask

Buy Up—
Buy Down—
Market's chance of Up
—
Since this market opened
—
Last minute
—
Spread
—

Settlement minute

The result is the average of BTC over the final 60 seconds.

Why the last minute decides it →

Pro chart

Indicator strength

Waiting

— / 100

1-minute average of the indicator strength

Live in Pro: which way the 15 scored indicators point, and how stronglyWhich way, how strong: live in Pro

An indicator reading, not advice. All 33 readings

BTC on the left scale, centred on the strike (the dashed line: above it is the Yes side). The Yes price on the right scale, 0–100¢; in Pro, the chance it flips on the same scale, 0–100%.

The bot's buys

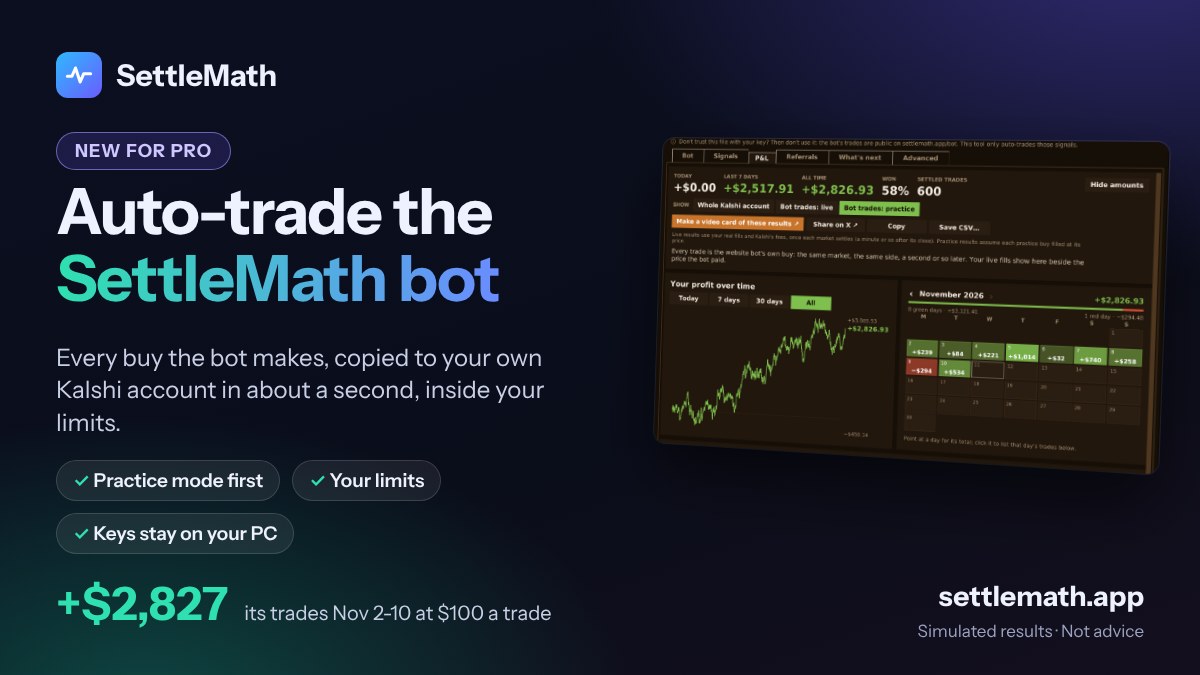
Every trade, wins and losses → Auto-trade the SettleMath bot: every buy copied to your own Kalshi account in about a second, inside your limits Auto-trade these buysWith Pro, the SettleMath Bot app places each one on your own Kalshi account, inside your limits.See how →

Why the bot buys one way right now

The bot doesn't choose a side. It copies the top 3 signals on the leaderboard, and a signal only gets there by winning on markets that came after it was found. When Bitcoin keeps drifting one way, the signals that keep winning are the ones that bet that way, so its buys go that way too.

That's on purpose: it bets the way that has been working and stays out of the way that hasn't. When the trend turns, a Down signal's edge fades, it loses its place after its losses, and Up signals that start winning climb in. The bot then follows them by itself; nobody has to flip a switch.

Up calls Looking for the best Up rule…

Up calls (the hollow green ▲ on the Live chart) come from the leaderboard's best Up signal, or while none holds up, from the scan's Up pick: its best Up rule in its latest check, which hasn't passed the luck check yet. Each call is recorded from the first market, wins and losses. They're a record, not trades: neither the website bot nor the app buys them. Live-price simulation, $100 a call, fees included; not advice.

Signal leaderboard

Ranked by what each signal made on markets that came after it was found or added ($10 the first time it fires in a market, from $100), not by how good it looked on the markets it was picked from. Updated after every market; 500 markets counted.

  1. Counting the signals' last markets…

The whole leaderboard and the simulator → Watch a bot trade the top 3 signals →

Why this order: the scan tries hundreds of thousands of combinations, so some look great on the markets it searched by luck alone. A record on markets that came afterwards can't be picked that way. "Held up" means 100 or more such fires the bot could trade, ahead on them by 2 standard errors over its whole record since found; until then a signal is "still being tested". Hypothetical results, with the asking price and fee; information, not advice. Arrows: the move since the last market.

59 signals ranked by what they made on new marketsPro sees the names, the records and the moves after every market, and opens any of them in the simulator in one tap. The bot trades the top 3.Unlock the leaderboard

Pro ranks every signal - the templates and the Lab signals the site's own scan finds - by what it made over the last markets, and opens any of them in the simulator in one tap. See plans

Your signals

Choose what is drawn on the chart: the built-in signals (the leaderboard's top 3 Lab signals), and your own from any of the page's numbers (when every condition is true, a line is drawn).

    Notifications

    Strategy simulatorRun a leaderboard signal, your own or a scan pick as a bankroll, trade by trade: flat or doubling, with stops. Scan for the best signals in the Lab →

    Pro lets you build your own test signals (say: volume under a level, RSI over 70 and the model over 80%) and draws a line on the chart each time they all line up. See plans

    Whale orders

      Pro shows every big market order on 11 exchanges the second it happens, and marks it on the chart. See plans

      Signals this window

      Notify me the moment a signal firesPro
      Play a sound when a signal firesPro
      Notify me the second the bot buysPro

      Choose which signals are drawn, or build your own: Your signals. Scan for the best signals in the Lab → Simulate any signal as a bankroll →

        Information, not advice: what the numbers did, logged with its record on the Accuracy page.

        Free view: each signal shows here and on the chart 3 minutes after it fires. Pro sees it the second it happens, with a chime or a phone alert, plus the Lab's vetted signals and the ones you build yourself. See plans

        Crowd: this market's own trades

        —

        of the last 2 minutes' trades took Yes

        One trade, one vote, whatever its size: which side the people trading this window are taking right now. 50% is even; the dotted line on the chart is the same number. Each indicator's record is on the Accuracy page.

        Pro shows which side the people trading this window are taking, trade by trade, as a line on the chart. See plans

        Chance the result flips

        —

        The model's chance that the side behind now finishes ahead.

        How often prices like this settled Yes

        —

        Pro shows how often Yes won in past windows when it traded at this price with this much time left. See plans

        Who is taking which side right now

        This market's trades, last 2 min

        —

        Bitcoin on 11 exchanges, last 60 s

        —

        This market's waiting orders within 2¢

        —

        Which side the trades are taking: the contracts traded on this market (each contract counts once, whatever its price), the coins taken at the asking price against those taken at the bid across 11 exchanges, and the orders waiting on each side. Each one's record as an indicator is on the Accuracy page.

        Pro shows which side the trades are taking, on this market and across 11 Bitcoin exchanges, live. See plans

        More detail: the order book

        Order book

        Yes bids

          Yes asks (No bids)

            Pro shows the top five levels on each side, the contracts resting within 2¢ of the mid, and how much depth was pulled in the last 10 seconds. See plans

            Indicators: 33 live readings

            —

            —

            IndicatorNowPoints

            15 indicators share 100 points: each one pointing Up adds its points, each pointing Down takes them away. 18 more are watched until their record earns them points. All 33 feed the SettleMath model, which weighs each by what it has actually done against the market's price, refitted every hour. Each one's own record is on the Accuracy page.

            Pro shows all 33 readings live: RSI, Bollinger, MACD, momentum, trend and acceleration, order flow on 11 exchanges and book depth on 5, the futures and Coinbase premiums, the fastest exchanges, whale orders and liquidations, the market's own book, price, velocity and trades, the other coins' 15-minute markets, and a 100-point strength score. See plans

            Why the final minute decides it

            The result isn't BTC's price at the close. It is the average of the last 60 seconds. Every second that passes is locked into that average for good.

            1. With 30 seconds left, half the average is already fixed.
            2. So to change the result, BTC has to move about twice as far as it would at the start of the minute, and the gap grows every second.
            3. The settlement panel above does that arithmetic live: how much is locked and what the rest must average to flip it.
            Why we average, and most price tools don't →

            Signals on your phone

            Get your own signals (add any leaderboard signal to yours) as notifications the moment they fire, even with this page closed: switch them on in the Signals card on the Bitcoin page, or have them posted in your Discord.

            The signals follow the Bitcoin market for now.

            How it works

            Session

            Volatility, as a 15-minute move

            —

            Last 20 windows

            Model last changed Nov 14 2026: The SettleMath model's buy signal retired; the Lab's top 3 are the built-in signals. Every change, dated

            New signal

            Start from a template
            Color
            When all of these are true

            A line is drawn the second every condition turns true, then again only after they have been false for 10 seconds (at most 5 a window). It is a test signal: information about the numbers, not advice.